Similarity between node degree and node strength
October 16, 2009 at 12:57 pm Leave a comment
In the paper Patterns and Dynamics of Users’ Behaviour and Interaction: Network Analysis of an Online Community, we found that those individuals with many connections (i.e., high degree) sent on average more messages to each of their contacts than those with fewer connections:
“we measured users’ average out-strength (instrength) as the average number of messages sent to (received from) others (Opsahl, Colizza, Panzarasa,&Ramasco, 2008). We expected hubs to be weakly connected to others, based on the conjecture that all users are homogeneously limited by the same constraints of resources and time. In this case, having more contacts should reduce the amount of resources and time spent on each of them (Burt, 1992). We were surprised to find a positive and significant (p<0.001) Pearson’s pairwise correlation coefficient between average out-strength (in-strength) and out-degree (in-degree) of 0.28 (0.44). This signals that hubs spend more time and resources with each of their contacts than the less connected users." (excerpt from page 919).
The heterogeneity in average tie weight for users with different levels of gregariousness might indicate that node degree and node strength are not correlated. This post aims to test this for the online social network used in the paper and compare degree and strength distributions.
Given that this is a directed network, each analysis is conducted twice – once for outgoing ties and once for incoming ties. The simplest way to test the association between two variables is to calculate the Pearson pair-wise correlation coefficient . This coefficient tests the linear relationship between two variables, and ranges from -1 to 1. If it is equal to 1, then there is perfect correlation between the two-variables, whereas if it is -1, the two variables are opposites of each other. A value of 0 is attained if there is no linear relationship between the two variables. For out-degree and out-strength, the coefficient is 0.90, and for in-degree and in-strength, the coefficient is 0.89. This indicates that degree and strength is highly correlated with each other (Cohen, 1988).
Since high correlation coefficients were found, it might be interesting to plot the relationships to ensure that extreme values are not distorting the coefficient. The relationships between the two types of degree and strength are:
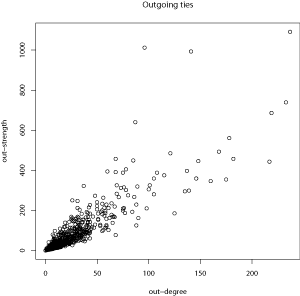
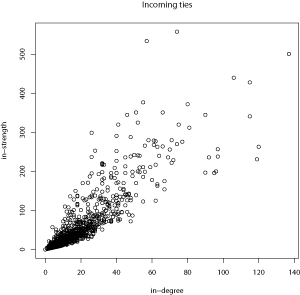
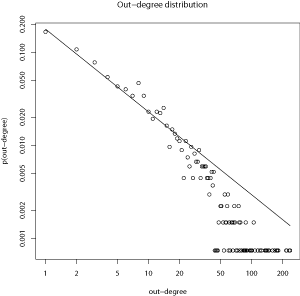
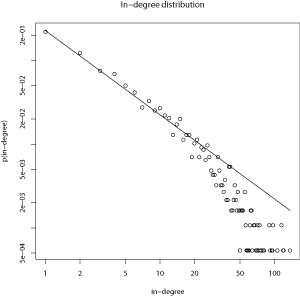
As it is possible to see from the above plots, there are a number of nodes with extremely high values of degree and strength. However, there are clear trajectories at low values of degree and strength, which might indicate that the outliers are not distorting the correlation coefficients. The fact that there are nodes with extremely high values of degree is not surprising given that power-law degree distributions with exponents of 0.89 and 1.005 were found in the paper:
Given the similarity between degree and strength, it would be interesting to test whether the strength distributions also follow a power-law distribution, and if so, if the exponent is similar to the ones for the degree-distributions:

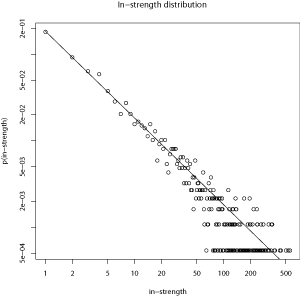
The exponents of the strength distributions are 0.87 and 1.004. Although I expected some similarity between the degree distributions’ exponents (0.89 and 1.005) and the strength distributions’ exponents, the numerical similarity is striking.
References
Burt, R. S., 1992. Structural Holes: The Social Structure of Competition. Harvard University Press, Cambridge, MA.
Cohen, J., 1988. Statistical power analysis for the behavioral sciences (2nd edition). Hillsdale, NJ: Erlbaum.
Opsahl, T., Colizza, V., Panzarasa, P., Ramasco, J. J., 2008. Prominence and control: The weighted rich-club effect. Physical Review Letters 101 (168702). arXiv:0804.0417.
Panzarasa, P., Opsahl, T., Carley, K.M., 2009. Patterns and dynamics of users’ behavior and interaction: Network analysis of an online community. Journal of the American Society for Information Science and Technology 60 (5), 911-932, doi: 10.1002/asi.21015
What to try it with your data?
Below is the code to calculate the numbers and create the diagrams used in this post. If you also would like to calculate the power-law with exponential cut-off, then you should remove the # on line 41.
# Load tnet
library(tnet)

# Load network
data(OnlineSocialNetwork.n1899)

`script` <-
function(net){
  output <- list()
  # Calculate out/in-degree/strength
  k <- cbind(degree_w(net), degree_w(net, type="in"))
  dimnames(k)[[2]] <- c("node","ko","so","node2","ki","si")
  if(sum(k[,"node"] == k[,"node2"])!=nrow(k))
    stop("Node ids does not match")
  k <- k[,c("node","ko","ki","so","si")]
  output[[1]] <- k

  # Get pair-wise correlation coefficients
  corro <- cor.test(k[,"ko"], k[,"so"])
  corri <- cor.test(k[,"ki"], k[,"si"])
  cat(paste("Pair-wise correlation between degree and strength:\n Out: ", corro$estimate, " (p-value: ", corro$p.value, ")\n In:  ", corri$estimate, " (p-value: ", corri$p.value, ")\n Note: If p-value equal 0, p-value is less than 2.2e-16\n", sep=""))
  output[[2]] <- corro
  output[[3]] <- corri

  # Degree distributions
  cat("Degree distributions\n")
  looprange <- c("ko","so","ki","si")
  for(j in 1:length(looprange)) {
    i <- looprange[j]
    tmp <- table(k[,i])
    tmp <- tmp[which(rownames(tmp)!="0")]
    tmp <- tmp/(sum(tmp))
    tmp <- as.data.frame(cbind(k=as.numeric(rownames(tmp)), pk=tmp))
    plaw <- nls(pk ~ C*k^(-t), data=tmp, start=list(C=1, t=1))
    plaweco <- nls(pk ~ C*k^(-t)*exp(-k/K), data=tmp, start=list(C=1, t=1, K=30))
    cat(switch(i,
      "ko" = " Out-degree",
      "so" = " Out-strength",
      "ki" = " In-degree",
      "si" = " In-strength"))
    cat(paste("\n  Powerlaw:  pk =", plaw$call$formula[3], "\n   Coefficients:\n    Con =", coef(plaw)["C"], "\n    tau =", coef(plaw)["t"]))
    # cat(paste("\n  Powerlaw with exponential cut-off: pk ", plaweco$call$formula[3], "\n   Coefficients:\n    Con =", coef(plaweco)["C"], "\n    tau =", coef(plaweco)["t"], "\n    cut =", coef(plaweco)["K"]))
    cat("\n")
    output[[(length(output)+1)]] <- tmp
    output[[(length(output)+1)]] <- plaw
    output[[(length(output)+1)]] <- plaweco
  }
  cat(" Note: These regressions in the article were performed in Stata 9\n The value of the cut-off parameter varies slightly between R and Stata\n")
  return(output)
}
output <- script(OnlineSocialNetwork.n1899.net)
k <- output[[1]]
plot(k[,"ko"], k[,"so"], main="Outgoing ties", xlab="out-degree", ylab="out-strength")
plot(k[,"ki"], k[,"si"], main="Incoming ties", xlab="in-degree",  ylab="in-strength" )

plot(output[[4]][,1], output[[4]][,2], main="Out-degree distribution", xlab="out-degree", ylab="p(out-degree)", log="xy")
lines(output[[4]][,1], fitted(output[[5]]))

plot(output[[7]][,1], output[[7]][,2], main="Out-strength distribution", xlab="out-strength", ylab="p(out-strength)", log="xy")
lines(output[[7]][,1], fitted(output[[8]]))

plot(output[[10]][,1], output[[10]][,2], main="In-degree distribution", xlab="in-degree", ylab="p(in-degree)", log="xy")
lines(output[[10]][,1], fitted(output[[11]]))

plot(output[[13]][,1], output[[13]][,2], main="In-strength distribution", xlab="in-strength", ylab="p(in-strength)", log="xy")
lines(output[[13]][,1], fitted(output[[14]]))
Entry filed under: Network thoughts. Tags: actors, arcs, centrality, complex networks, degree, directed networks, edges, global, graphs, gregariousness, hubs, Links, local, network, nodes, online communication, online social networks, popularity, reinforcement, social network analysis, social networking site, strength of nodes, strength of ties, ties, valued networks, vertices, weighted networks.
 RSS feed
Subscribe to the comments via RSS Feed