Thesis: 2.3 Empirical tests
An article based on this chapter has been published
(Opsahl and Panzarasa, 2009). This article was written after this chapter and contains a number of changes.
We now test the proposed generalisation on ten of the networks outlined in Chapter 1. (We do not apply the proposed method to the scientific collaboration and the US airport network. The scientific collaboration network is a one-mode projection of a two-mode network that discounts the tie weights within large collaboration. This creates a number of biases for the weighted clustering coefficient as a single large collaboration would create many closed triplets composed of weak ties (see Section 1.4). Therefore, we choose not the use this dataset. The complete US airport network is not publicly available, and this Chapter was not created in collaboration with others who had access to the network. Thus, we could not use this network in this Chapter.), (Network measures and statistics are calculated on symmetrised matrices for directed networks. We choose to symmetrise using the sum method (i.e., tie weights are equal to the sum of the weights attached to the two possible directed ties between two nodes), because this method creates a wider range of values instead of the maximum method. For the binary coefficient, the networks are also dichotomised with different cut-offs (i.e.,  refers to Eq. 2 where ties with a weight greater than X are set to present, whereas ties with a weight lower than or equal to x are removed). Unless otherwise specified, ties are set to present if their weight is greater than 0, and the generalised coefficient uses the geometric mean method for defining triplet value (
 ). A function to calculate the binary and generalised clustering coefficient is available in the tnet package implemented in the open-source statistical programme R (see Chapter 5 for more details).) We also compare the generalised clustering coefficient with the binary one measured with different cut-offs. In particular, we compare the generalised coefficient with the one found where all ties with a weight greater than 0 is set to present. This comparison allows us test a key assumption used by Granovetter’s (1973) in his the strength of weak ties theory (Freeman, 1992). He assumed that a person’s friends (i.e., strong ties) are more likely to be connected with each others than acquaintances (i.e., weak ties). Based on the assumption that acquaintances were disconnected from a person’s other contacts, he argued that they were more likely to bring novel information to the focal person than friends as they moved in different social circles, whereas friends moved in the same social circle.
The first three networks are Freeman’s EIES networks (Freeman, 1978). The three networks are highly dense with densities (the randomly expected value of the clustering coefficient) of 0.78, 0.87, and 0.54, respectively. They also exhibit a fairly large tendency toward clustering;  for the three networks is 0.8417, 0.9010, and 0.6569, respectively. When the proposed generalisation is applied, all three networks experience an increase in clustering:
 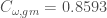 , 0.9146, and 0.7654, respectively. For the acquaintance networks the increase is 2.1% and 1.5%, whereas for the frequency matrix the increase is relatively higher at 16.5%.
The fourth network is the online social network (Panzarasa et al., 2009). This network exhibits a density of 0.0077 and a clustering coefficient of  . We found a generalised clustering coefficient of
  . This represents an increase of 22.2%.
The next four networks are the intra-organisational networks (Cross and Parker, 2004). All four networks do exhibit a high clustering coefficient: ranges between 0.6723 and 0.7242, and between 0.7200 and 0.7750. This represents an average increase of 7.1% when the generalised coefficient is applied.
The ninth network represents political support in the US senate (101st Congress, 1989/1990, also used in Skvoretz, 2002). This network has a density of 0.78. As the network is almost fully connected, it is difficult to draw conclusions from . We found:  . The average undirected tie weight is 3.99 and the maximum weight is 42. The great difference between the mean and the maximum signals that most ties are relatively weak. This is an indication that a higher cut-off might be more appropriate. In Table 3, we list C calculated using higher cut-offs. Applying the generalised coefficient, we found
 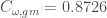 . This represents an increase of 3.7%. A plausible explanation for this increase is the fact that party membership and ideologies represent a constraint on the strength of ties among senators (open triplets). In particular, senators belonging to different parties are likely to co-sponsor a limited number of bills. Thus, the value of closed triplets connecting senators from different parties tends to be small.
The tenth network is the neural network of the Caenorhabditis elegans worm. The density is 0.0460 in this network. We found:  and
and  . This is a decrease of 3.3%.

Table 3: Comparison between the generalised and the binary clustering coefficients.
Table 3 sums up the empirical results. A number of observations are in order. First, the binary clustering coefficient, , generally decreases as the cut-off, X, increases for all of the networks. The rate of decrease differs considerably among the networks. Moreover, the decrease is not linear. In fact, although not shown in Table 3 as only every second value of the cut-off is shown, the clustering coefficient even increases at some of the levels. In addition, the reliability of the results when high cut-offs are used should be questioned as there are only few triplets and triangles left in the network with high cut-offs. Thus, these findings from a sensitivity analysis of the binary clustering coefficient are difficult to interpret.
Second, there are variations in the generalised clustering coefficient,  , when different methods for defining the triplet value are used. The highest is attained when the “minimum” method is used, whereas the lowest outcome is attained when the “maximum” method is used for most of the networks. This means that triplets consisting of two ties with approximately the same weight are likely to be closed. Different results are found for Freeman’s frequency matrix, C.elegans’ neural network, and the online social network, with the reverse found in the first two networks. A possible reason for this difference is that these three networks have the greatest range of tie weights (946, 71, and 183, respectively). If certain ties have extremely large weights attached to them, the fraction in Eq. 3 becomes sensitive to whether these ties form part of closed or open triplets. Moreover, the similarity of the two tie weights in a triplet might affect the likelihood of closure. For example, there is greater variation in the weights of the second triplet in Table 1 than in the ones of the first triplet. If these two triplets are closed, the second triplet would add more to the fraction in Eq. 3 than the first triplet if the maximum method is used, whereas the reverse is true if the minimum method is used. Therefore, by obtaining the highest outcome using the “maximum” method for Freeman’s frequency matrix and C.elegans’ neural network, we argue that triplets consisting of ties with greater variation in weights are more likely to be closed than triplets consisting of ties with roughly the same weight.
Third, the generalised clustering coefficient is higher than the binary coefficient for all social networks. When networks are dichotomised by setting ties with weights greater than 0 to present, the binary clustering coefficient is a benchmark for the generalised one. As shown by simulations in Section 2.2, when the tie weights are randomly assigned to the ties,  . By comparing to , we can assess whether strong triplets are more likely to be closed than weak triplets. If the generalised clustering coefficient is significantly higher than the binary clustering coefficient, strong triplets are more likely to be closed than weak ones, whereas when the reverse is the case, weak triplets are more likely to be closed than strong ones. The findings therefore support the claim by Granovetter (1973) that stronger ties are more likely to be part of transitive triplets in social networks than weak ones.


Trackback this post | Subscribe to the comments via RSS Feed